

Plotting: Exercises and Solutions
Plotting rank-ordered ratings for 90s movies
Exercise
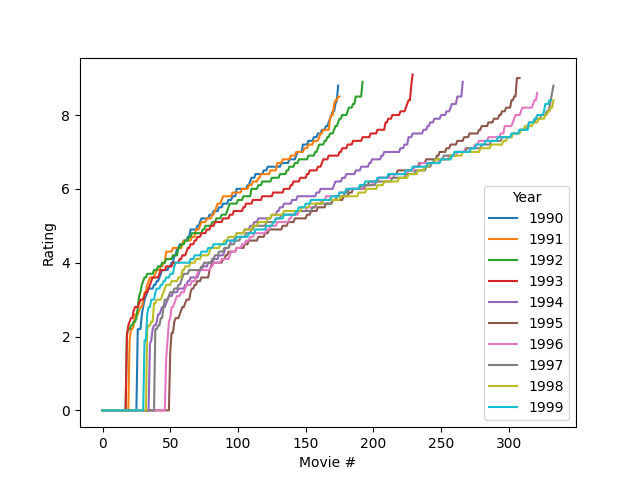
Using this dataset, for each year in the 90s separately, plot the ratings for individual movies, rank-ordered such that the lowest-rated movies start on the left. The resulting plot consists of ten lines (for each year in the 90s) that gradually go up, with each datapoint corresponding to a single movie rating.
Solution
from matplotlib import pyplot as plt
from datamatrix import io, operations as ops

dm = io.readxlsx('data/movies.xlsx')
dm = (dm.year >= 1990) & (dm.year < 2000)
for year, year_dm in ops.split(dm.year):
    plt.plot(sorted(year_dm.rating), label=year)
plt.legend(title='Year')
plt.ylabel('Rating')
plt.xlabel('Movie #')
plt.show()
Output:
/home/sebastiaan/anaconda3/envs/pydata/lib/python3.13/site-packages/datamatrix/py3compat.py:105: UserWarning: Some rows miss column title
warnings.warn(safe_str(msg), *args)
[32m⠸[0m Generating...
You're done with this section!
Continue with Plotting >>